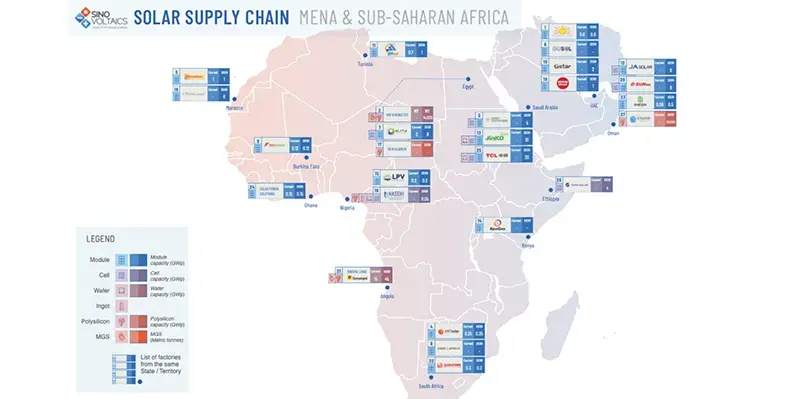
For the first time, Sinovoltaics, a Hong Kong-based technical compliance and quality assurance firm, has unveiled a dedicated Solar Supply Chain Map for the Middle East and Africa
The map highlights the regions’ advancing ambitions to achieve full vertical integration in solar PV manufacturing. Covering the entire value chain, from polysilicon production to module assembly, the initiative underscores the growing role of the Middle East and Africa as supply hubs for both domestic demand and international markets, particularly in Europe and sub-Saharan Africa.
At present, the regions’ nameplate capacity includes 3.4 GW of PV modules, 2.5 GWof solar cells, and 8.05 GW of ingot production. Looking ahead to 2030, ambitious growth targets have been set. Projections indicate the Middle East and Africa could reach 62.12 GW of module manufacturing, 52.55 GW of solar cell capacity, 45 GW of polysilicon production, and 290,000 tons of metallurgical-grade silicon.
“This manufacturing expansion is designed to close supply gaps in regional markets and North America, where limited upstream solar component production and low tariffs create strong demand. Although challenges remain, such as grid infrastructure limitations and logistical bottlenecks, the MENA region’s solar manufacturing capacity is poised for significant growth,” said Dricus de Rooij, CEO and co-founder of Sinovoltaics.
While much of the planned capacity is being supported by Chinese companies, the Middle East and Africa are gradually positioning themselves as alternative suppliers to Southeast Asia, which has traditionally dominated global solar exports. With their strategic geographic location, the regions are well-placed to serve European markets and could also provide exports to North America depending on U.S. trade policies. However, South African modules still face a 30% tariff in the United States, limiting near-term opportunities.
The Sinovoltaics Middle East and Africa Solar Supply Chain Map currently identifies 27 factory sites. The report offers comprehensive details on facilities producing PV modules, solar cells, wafers, ingots, polysilicon, and metallurgical-grade silicon. Based largely on public announcements, this new resource provides valuable insights for industry stakeholders into the rapid industrialisation of the solar sector in the regions and is available for free download.
For comparative analysis of Asia’s solar manufacturing industry, including Southeast Asia, readers are encouraged to refer to Sinovoltaics’ Southeast Asia Solar Supply Chain Map.


